

SJS Weekly Market Update
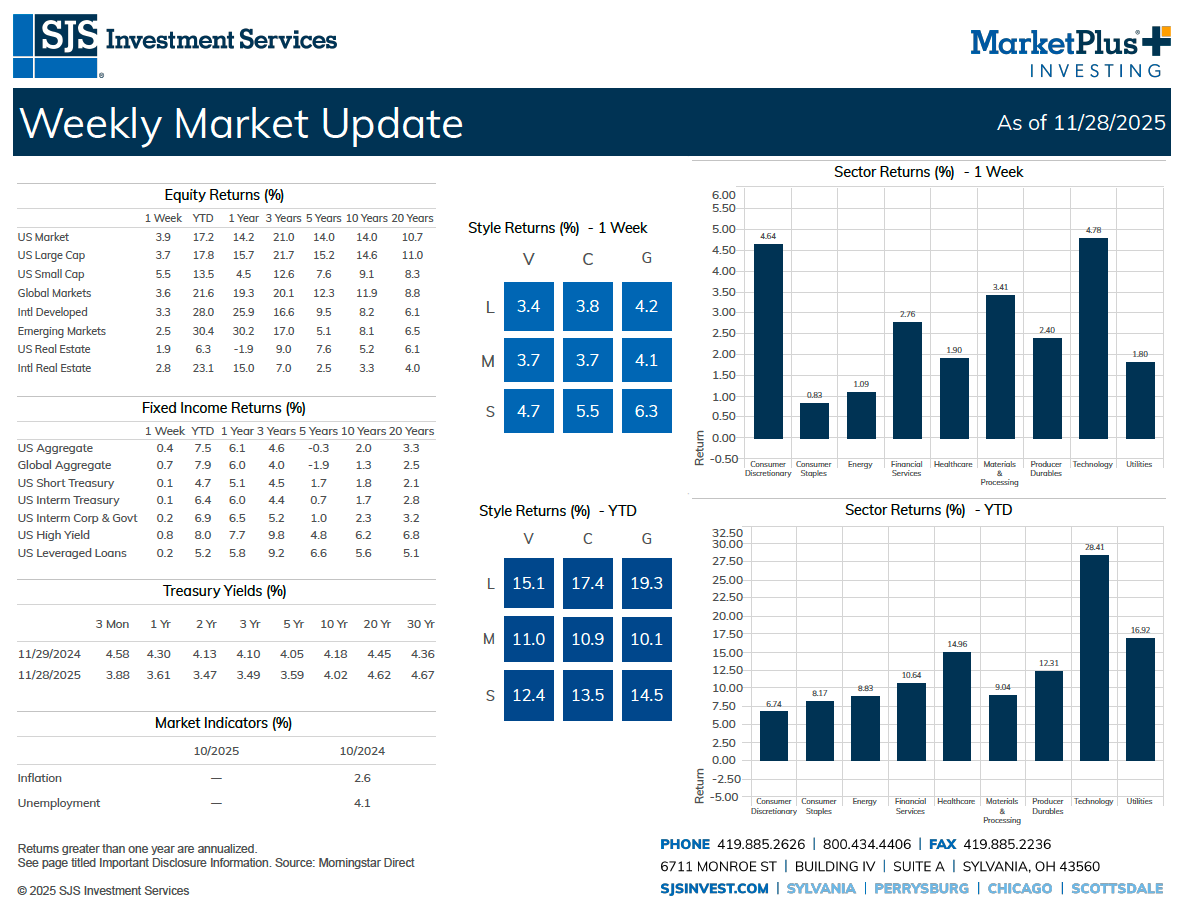
SJS Investment Services creates a weekly market update to summarize performance characteristics for major stock and bond indices.
Each week, SJS Investment Services creates a Weekly Market Update to summarize performance characteristics for major stock and bond indices. Please click on the below image to view the most recent Weekly Market Update PDF.
Past Weekly Market Updates:
Important Disclosure Information:
Past performance does not guarantee future results. There is no guarantee investment strategies will be successful. Diversification neither assures a profit nor guarantees against a loss in a declining market. Indices are not available for direct investment. Their performance does not reflect the expenses associated with management of an actual portfolio. This material has been prepared for informational purposes only.
All returns represent total return (including reinvestment of dividends) for stated period provided by Morningstar Direct.
Equity indexes are as follows: US Market (Russell 3000 TR USD Index measures the performance of the largest 3000 US companies representing approximately 98% of the investable US equity market. It is market-capitalization weighted.); US Large Cap (S&P 500 TR USD Index measures the performance of 500 widely held stocks in US equity market. Standard and Poor's chooses member companies for the index based on market size, liquidity and industry group representation. Included are the stocks of industrial, financial, utility, and transportation companies. Since mid 1989, this composition has been more flexible and the number of issues in each sector has varied. It is market capitalization-weighted.); US Small Cap (Russell 2000 TR USD Index measures the performance of the small-cap segment of the US equity universe. It is a subset of the Russell 3000 and includes approximately 2000 of the smallest securities based on a combination of their market cap and current index membership. Russell Investment Group is the source and owner of the trademarks, service marks and copyrights related to the Russell Indexes. Russell® is a trademark of Russell Investment Group.); Global Market (MSCI ACWI GR USD Index measures the performance of the large and mid cap segments of all country markets. It is free float-adjusted market-capitalization weighted.); Intl Development (MSCI EAFE GR USD Index measures the performance of the large and mid cap segments of developed markets, excluding the US & Canada equity securities. It is free float-adjusted market-capitalization weighted.); Emerging Markets (MSCI Emerging Markets GR USD Index measures the performance of the large and mid cap segments of emerging market equity securities. It is free float-adjusted market-capitalization weighted.); US Real Estate (DJ US Select REIT TR USD Index measures the performance of publicly traded real estate investment trusts(REITs) and REIT-like securities. The index is a subset of the Dow Jones US Select Real Estate Securities Index (RESI). The index is designed to serve as proxy for direct real estate investment, in part by excluding companies whose performance may be driven by factors other than the value of real estate.); Intl Real Estate (S&P Global Ex US REIT TR USD Index measures the performance of publicly traded REITs and REIT-like securities, excluding those in the U.S., and is a sub-index of the Dow Jones Global ex-U.S. Select Real Estate Securities Index (RESI). The index is designed to serve as a proxy for direct real estate investment, in part by excluding companies whose performance may be driven by factors other than the value of real estate.
Fixed Income indexes are as follows: US Aggregate – (Bloomberg Barclays US Aggregate Bond TR USD Index measures the performance of investment grade, U.S. dollar-denominated, fixed-rate taxable bond market, including Treasuries, government-related and corporate securities, MBS (agency fixed-rate and hybrid ARM passthroughs), ABS, and CMBS. It rolls up into other Barclays flagship indices, such as the multi-currency Global Aggregate Index and the U.S. Universal Index, which includes high yield and emerging markets debt.); Global Aggregate (Bloomberg Barclays Global Aggregate TR USD Index measures the performance of global investment grade fixed-rate debt markets, including the U.S. Aggregate, the Pan-European Aggregate, the Asian-Pacific Aggregate, Global Treasury, Eurodollar, Euro-Yen, Canadian, and Investment Grade 144A index-eligible securities.); US Short Treasury – ICE BofAML 1-3Y US Trsy TR USD Index measures the performance of US dollar denominated sovereign debt publicly issued by the US government in its domestic market. Qualifying securities must have at least 1 year and less than 3 year remaining term to final maturity, a fixed coupon schedule and a minimum amount outstanding of $1 billion. It is capitalization-weighted.); US Interm Corp & Govt (ICE BofAML 1-5Y US Corp&Govt TR USD Index is a subset of BofA Merrill Lynch US Corporate & Government Index including all securities with a remaining term to final maturity less than 5 years. The BofA Merrill Lynch US Corporate & Government Index tracks the performance of US dollar denominated investment grade debt publicly issued in the US domestic market, including US Treasury, US agency, foreign government, supranational and corporate securities. Treasury Yields are as follows: US Treasury T-Bill Constant Maturity Rates (These rates are commonly referred to as "Constant Maturity Treasury" rates, or CMTs. Yields are interpolated by the Treasury from the daily yield curve. This curve, which relates the yield on a security to its time to maturity is based on the closing market bid yields on actively traded Treasury securities in the over-the-counter market. These market yields are calculated from composites of indicative, bid-side market quotations (not actual transactions) obtained by the Federal Reserve Bank of New York at or near 3:30 PM each trading day. The CMT yield values are read from the yield curve at fixed maturities, currently 1, 2, 3 and 6 months and 1, 2, 3, 5, 7, 10, 20, and 30 years. This method provides a yield for a 10 year maturity, for example, even if no outstanding security has exactly 10 years remaining to maturity.)
Style Returns: Style box returns are based on the Russell Index Style - Russell 1000 Value Index (Measures the performance of those Russell 1000 companies with lower price-to-book ratios and lower forecasted growth values), Russell 1000 Index (Measures the performance of the largest 1,000 securities in the Russell 3000 based on market cap and current index membership), Russell 1000 Growth Index (Measures the performance of those Russell 1000 companies with higher price-to-book ratios and higher forecasted growth values), Russell Mid Cap Value Index (Measures the performance of those Russell Mid Cap companies with lower price-to-book ratios and lower forecasted growth values), Russell Mid Cap Index (The Russell Midcap Index includes the smallest 800 securities in the Russell 1000), Russell Mid Cap Growth Index (Measures the performance of those Russell Mid Cap companies with higher price-to-book ratios and higher forecasted growth values),Russell 2000 Value Index (Measures the performance of those Russell 2000 companies with lower price-to-book ratios and lower forecasted growth values), Russell 2000 Index (The Russell 2000 includes the smallest 2000 securities in the Russell 3000), Russell 2000 Growth Index (Measures the performance of those Russell 2000 companies with higher price-to-book ratios and higher forecasted growth values).
Sector Returns: Sectors are based on the Russell Sector Classification methodology. Return data are calculated by Morningstar Direct using constituents and weights as provided by MSCI for the All Country World Index.
Market Indicator Indexes are as follows: Inflation - (The Consumer Price Index for All Urban Consumers: All Items (CPIAUCSL) is a measure of the average monthly change in the price for goods and services paid by urban consumers between any two time periods. It can also represent the buying habits of urban consumers. This particular index includes roughly 88 percent of the total population, accounting for wage earners, clerical workers, technical workers, self-employed, short-term workers, unemployed, retirees, and those not in the labor force.); Unemployment - (The unemployment rate represents the number of unemployed as a percentage of the labor force. Labor force data are restricted to people 16 years of age and older, who currently reside in 1 of the 50 states or the District of Columbia, who do not reside in institutions (e.g., penal and mental facilities, homes for the aged), and who are not on active duty in the Armed Forces. This rate is also defined as the U-3 measure of labor underutilization. The series comes from the 'Current Population Survey (Household Survey)').
Suggested Reading

What's The (Gold) Rush?
Gold has delivered eye-catching gains in recent years, surging past $4,000 per ounce this year and headlining financial media with talk of safe havens, inflation fears, and geopolitical uncertainty. This performance has increased investor enthusiasm, but history and research suggest caution.

Gold has delivered eye-catching gains in recent years, surging past $4,000 per ounce this year and headlining financial media with talk of safe havens, inflation fears, and geopolitical uncertainty.[1] This performance has increased investor enthusiasm, but history and research suggest caution.
At SJS, we believe investments should be grounded in fundamentals. Assets ought to generate earnings or possess inherent value beyond the hope of resale at a higher price. When the rationale for owning something is simply that someone else might pay more for it later, we’ve crossed into speculation - where value is propelled by hope or hype.
Gold is a unique asset. It doesn’t produce income like stocks or bonds. It doesn’t compound, doesn’t pay dividends, and for most investors, it has limited practical use. Its value is largely determined by sentiment by what someone else is willing to pay for it, which makes it inherently different from productive assets.
The supply of gold remains relatively stable; demand is less so. Gold supply is driven by mining and recycling, with lab-grown gold contributing in rare cases. Advances in lab-grown gold may increase supply in the future, with the impact on prices difficult to predict. Investor psychology, macroeconomic fears, and geopolitical tensions can all drive demand, and therefore price, in unpredictable ways. This volatility creates a mismatch with the narrative often attached to gold: that it is a reliable hedge against inflation. But historically, gold has not consistently behaved as an inflation offset. Its price movements are often more volatile than inflation itself, and its correlation with inflation is far from perfect.
Comparatively, the long-term value of stocks is driven by the profits and cash flows of the underlying businesses. The long-term value of fixed income is driven by contractual payments with businesses and other entities in exchange for providing financing. We think that there are more robust economic theories underlying why stocks and fixed income will increase over time than for gold.
Since 1969, gold has lagged U.S. stock returns. Its annualized return has been lower than the S&P 500 Index, while its standard deviation, a measure of risk, has been notably higher from April 1969 to October 2025.[1]
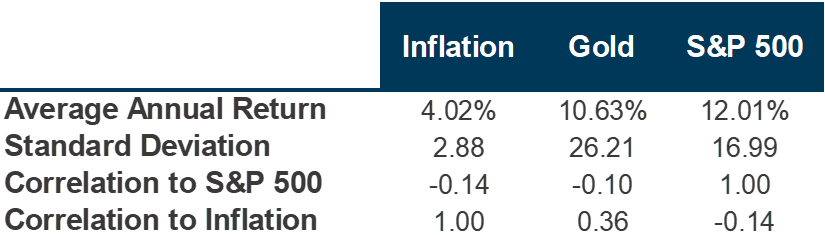
Source: Morningstar. Data spans from 4/30/1969 – 10/31/2025 for average annual return, standard deviation, and correlations. Inflation is represented by the US BLS CPI All Urban SA. Gold is represented by the LBMA Gold Price PM USD, the official benchmark price for gold set in US dollars each afternoon in London, used globally to standardize gold pricing. S&P 500 is represented by the S&P 500 TR Index. See Important Disclosure Information.
Gold is not new - it has been used as a currency and investment asset for thousands of years. Based on a 2025 study by Claude Erb and Campbell Harvey, gold has held its after-inflation value for the last 2,000-plus years; at the same time, its after-inflation purchasing power has not changed much, which implies a real return around 0%.[2]
This 2,000-plus year performance is in contrast to the past few decades, when gold has performed well. Even the recent performance has been uneven - a gold investor would have had to endure nearly 25 years of cumulative losses from the early 1980s to the mid 2000s. While no one knows what will happen, historical precedent does not lead us to be optimistic about the future prospects of gold.

Source: Morningstar. Gold is represented by the LBMA Gold Price PM USD, the official benchmark price for gold set in US dollars each afternoon in London, used globally to standardize gold pricing. The SPDR® Gold Shares ETF (GLD) was the first gold ETF launched in the U.S. on November 18, 2004. See Important Disclosure Information.
While gold has hedged against inflation and has preserved purchasing power for over 2,000 years, few of our clients have such a long investment horizon. Over shorter periods, gold has exhibited volatility comparable to stocks. Even though direct ownership of gold may not be our preferred strategy, there are several indirect approaches that can help create exposure to gold, serving as useful portfolio diversifiers during periods of speculation.
One option is to invest in companies connected to gold supply and demand, such as mining firms. In a well-diversified portfolio, ownership of these companies is typically already included as part of broader market exposure. Another approach is to access gold exposure through alternative investment strategies - such as buying & selling gold futures within a diversified investment strategy as well as providing price certainty to investors through insurance-like instruments - that have historically been profitable. These methods can be particularly beneficial in times of heightened inflation or when inflation expectations are rising.
When considering investing in gold, it is important to remember historical lessons. During the California Gold Rush in the mid-1800s, the reported wealthiest individual in California was not a gold miner, but a businessman who profited from selling mining supplies and publishing news about the rush.[3][4] While gold remains a time-tested store of value, we believe that successful investing requires a balanced approach that considers both historical insights and practical portfolio strategies that are not solely focused on golden opportunities to strike it big.
Important Disclosure Information & Sources:
[1] Source: LBMA. Gold is represented by the LBMA Gold Price PM USD, the official benchmark price for gold set in US dollars each afternoon in London, used globally to standardize gold pricing.
The S&P 500 TR Index tracks the price changes of 500 leading publicly traded US companies.
Inflation is represented by the US BLS CPI All Urban SA, which measures the average change over time in the prices paid by urban consumers for a market basket of goods and services in the US, seasonally adjusted.
[2] “Understanding Gold”. Claude B. Erb and Campbell R. Harvey, 07-Oct-2025, papers.ssrn.com.
[3] “California Gold Rush”. History.com Editors, 28-May-2025, history.com.
[4] “Samuel Brannan: Gold Rush Entrepreneur”. PBS, pbs.org.
Past performance does not guarantee future results. Diversification neither assures a profit nor guarantees against a loss in a declining market. There is no guarantee investment strategies will be successful. Past performance is no guarantee of future results.
Indices are not available for direct investment. Their performance does not reflect the expenses associated with management of an actual portfolio. Index performance is measured in US dollars. The index performance figures assume the reinvestment of all income, including dividends and capital gains.
MarketPlus® Investing models consist of registered investment companies. Investment values will fluctuate, and shares, when redeemed, may be worth more or less than original cost.
Statements contained in this document that are not statements of historical fact are intended to be and are forward looking statements. Forward looking statements include expressed expectations of future events and the assumptions on which the expressed expectations are based. All forward looking statements are inherently uncertain as they are based on various expectations and assumptions concerning future events and they are subject to numerous known and unknown risks and uncertainties which could cause actual events or results to differ materially from those projected.

A Cautionary Tale of Concentration & Exuberance
The value of investment markets lies in the unknowable future. No one knows exactly what comes next - despite what some may claim. What we do know, grounded in academic research, is that valuations matter.
By Chief Investment Officer Tom Kelly, CFA.
The value of investment markets lies in the unknowable future. No one knows exactly what comes next - despite what some may claim.
What we do know, grounded in academic research, is that valuations matter. Today, the S&P 500 Index (a proxy for U.S. stocks) is pressing against historical highs in Forward Price-to-Earnings (P/E). U.S. stock markets are also currently significantly richer than their international counterparts, based on historical data.

Source: Morningstar. Stock markets are represented by the following indices: US - S&P 500 Index; International Developed - MSCI World ex USA Net Return USD; Emerging Markets - MSCI Emerging Markets Net Return USD. 12-Month Forward P/E ratio is a stock valuation metric that divides a company's current stock price by its projected earnings per share (EPS) over the next 12 months. See Important Disclosure Information. *Interquartile range reflects the "middle 50%" of the range of historical valuations from the 25th to 75th percentile.
We also know that concentration reduces diversification across securities, leaving portfolios more exposed to the performance of a handful of stocks - for better or worse. Currently, concentration in the S&P 500 is close to as high as it has been.
We’ve seen valuations and concentration like this before. In the late 1990s, technology companies dominated the market. When the dot-com bubble burst in 2000, the S&P 500 index earned -9% (-1% annualized) over the following ten years beginning in January 2000, a stretch many still call “the lost decade.” During that same period, International Developed stocks eked out a 17% gain (2% annualized), while Emerging Markets stocks surged 154% (10% annualized). Diversification proved its worth.1
Since then, the S&P 500 has more than recovered, compounding over 14% annually and outpacing other international stocks by a wide margin.1 Understandably, this success leaves some investors wondering, "Why not invest solely in a S&P 500 Index fund?" But imagine opening your portfolio statement after ten years and seeing a negative number. Not a pleasant memory for those who lived through it.
Given ever-present uncertainty, the best we can do for you is to continue to hone the art of matching your goals and risk profile with a portfolio design that you won’t abandon in a down market. That philosophy is why we resist the temptation to chase what has worked most recently. What matters most is building a portfolio you can stick with, through good times and bad.
So far this year as of September 30th, the S&P 500 is up 15%. International Developed and Emerging Markets stock indices have returned 25% and 28%, respectively. We’ll gladly take these results of this global exposure. While our portfolios are not immune to market movements, diversification remains a core principle of MarketPlus® Investing.1
We are not predicting a crash in U.S. stocks. They may very well continue climbing, fueled by AI developments. But risks include both those we can see and those we cannot yet imagine. Continually reviewing valuations and investment market expectations when shaping portfolio design is one of the many ways we strive to help you cut through the noise of the markets and focus instead on time-tested strategies designed to help you achieve your long-term goals.
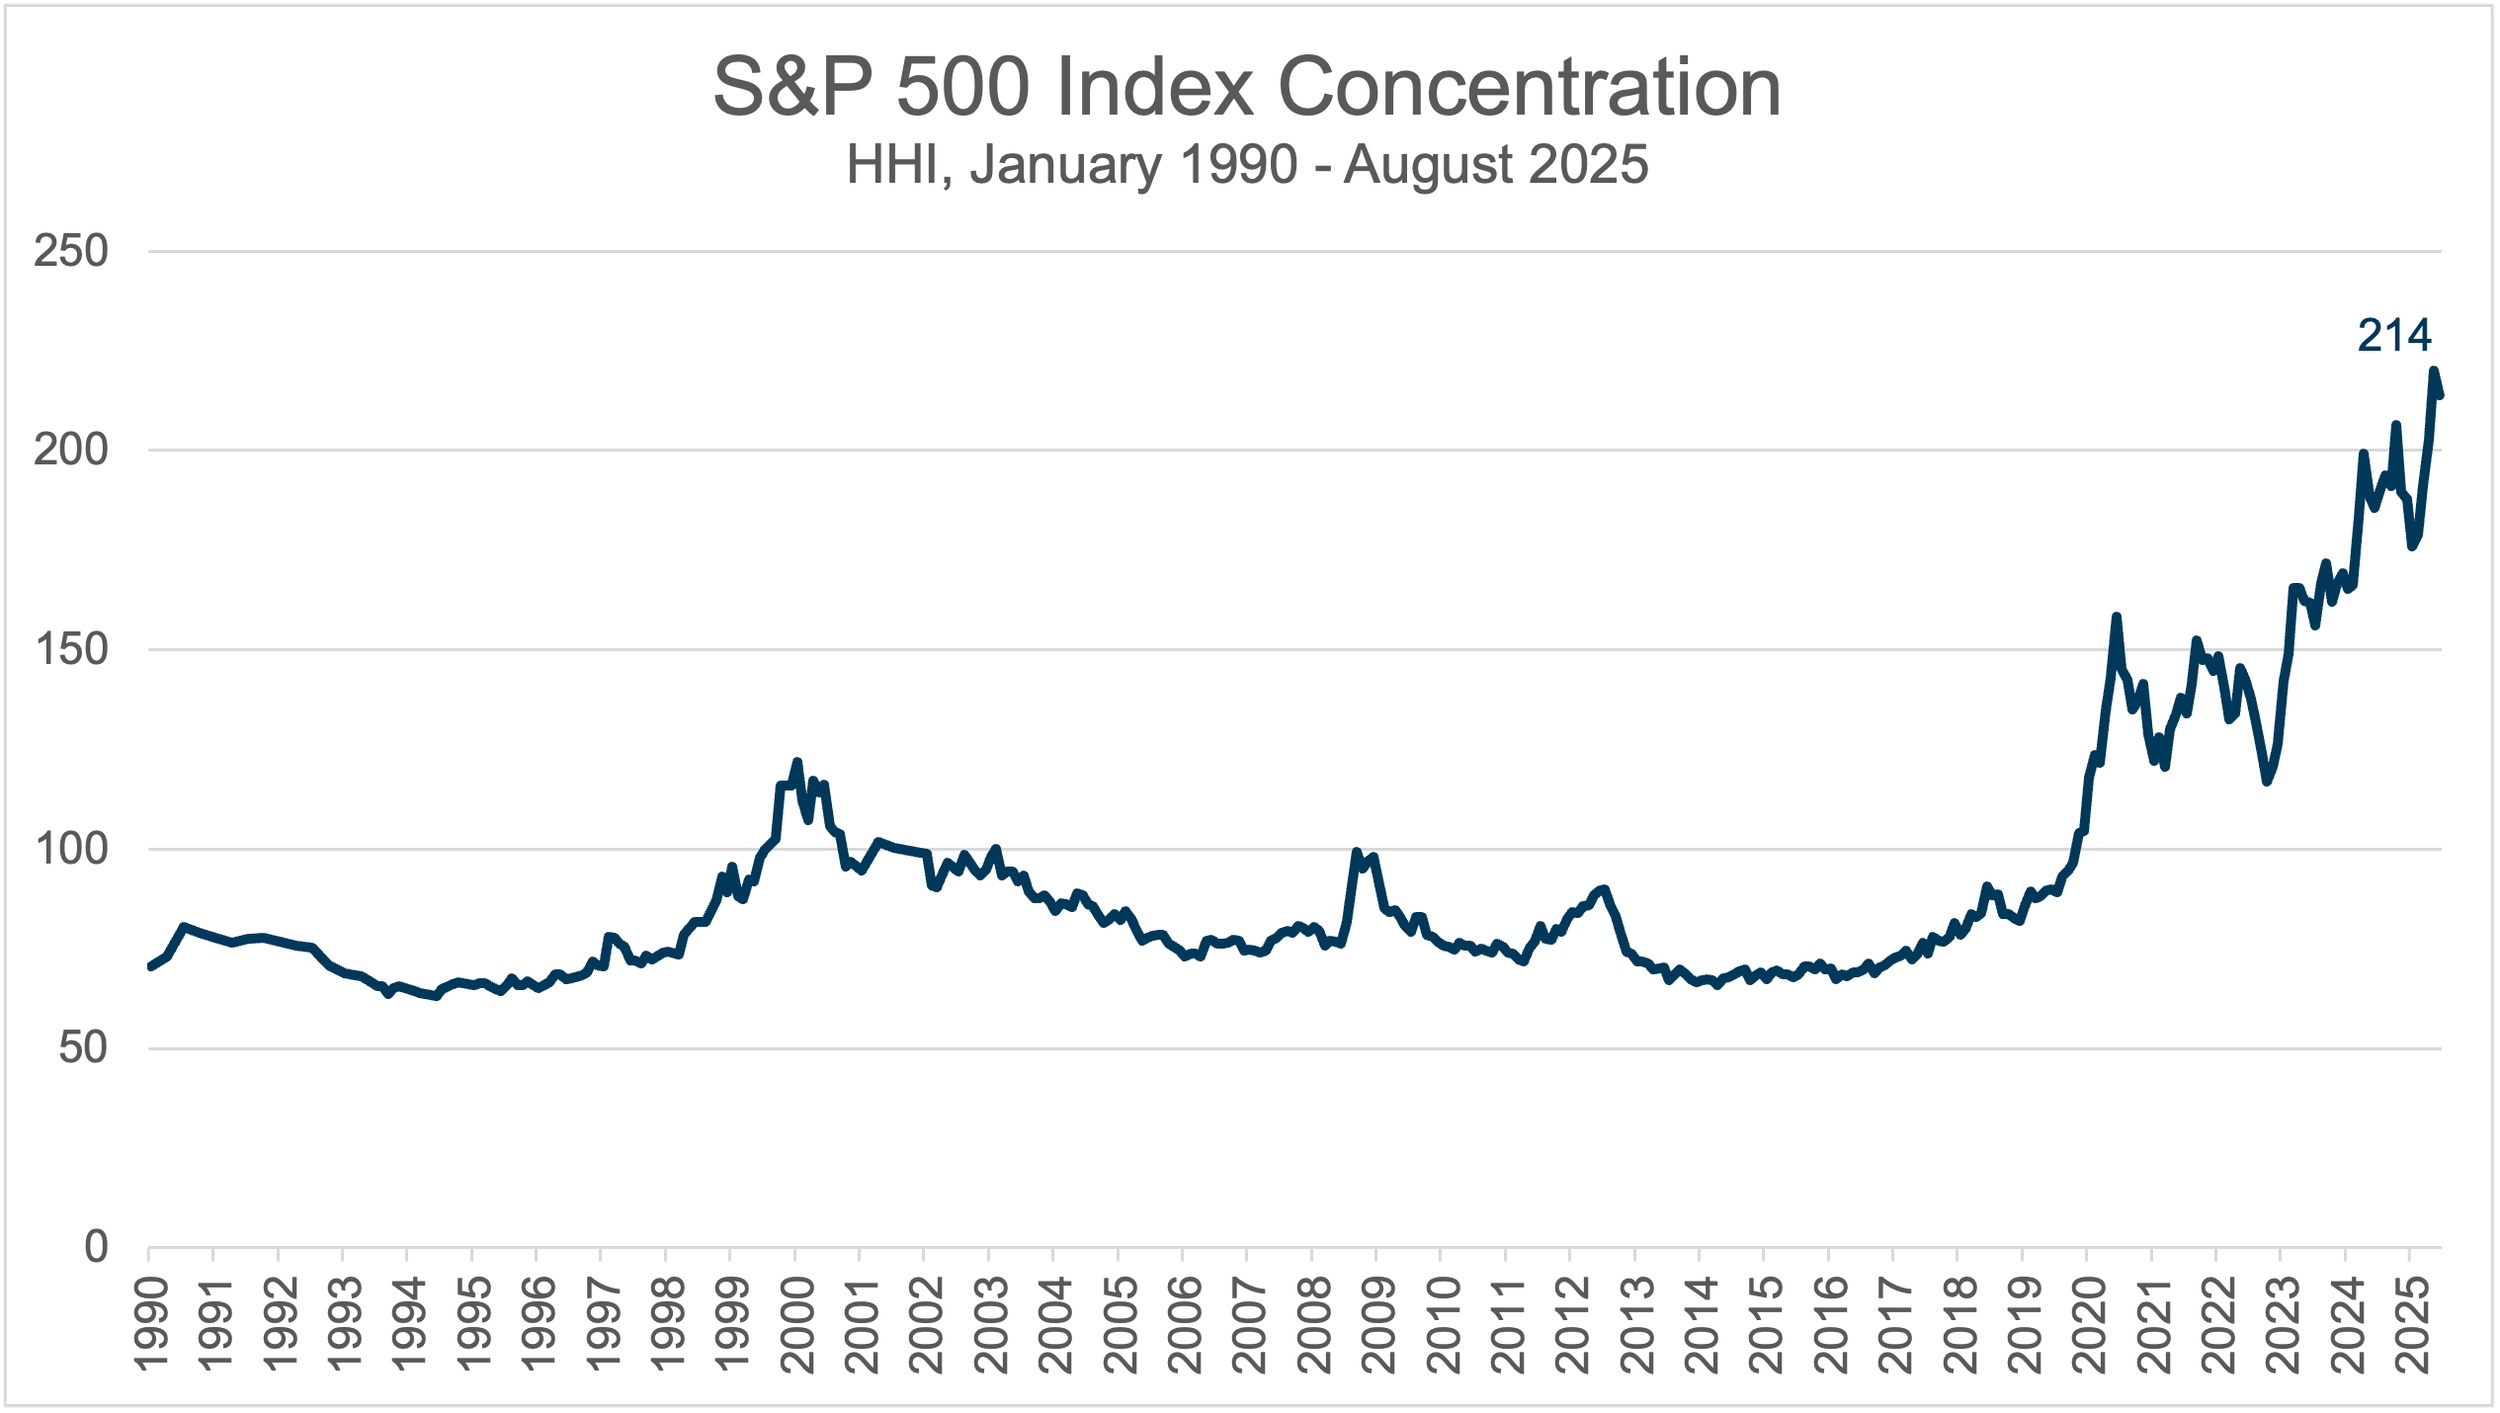
Source: Morningstar. Market concentration is measured by the Herfindahl–Hirschman Index (HHI), which in this case is calculated by squaring the market share of each firm in the S&P 500 index and then summing the resulting numbers. See Important Disclosure Information.
Important Disclosure Information:
1 US Stocks are represented by the S&P 500 index, which includes 500 leading U.S. listed companies, covering approximately 80% of available market capitalization. International Developed stocks are represented by the MSCI World ex USA Net Return USD Index, which covers approximately 85% of the free float-adjusted market capitalization in each of 22 of 23 developed markets countries - excluding the USA. Emerging Markets stocks are represented by the MSCI Emerging Markets Net Return USD, which covers approximately 85% of the free float-adjusted market capitalization in each of 24 emerging markets countries. Data from Morningstar.
There is no guarantee investment strategies will be successful. Past performance is no guarantee of future results. Diversification neither assures a profit nor guarantees against a loss in a declining market.
Indices are not available for direct investment. Index performance does not reflect the expenses associated with management of an actual portfolio. Index performance is measured in US dollars. The index performance figures assume the reinvestment of all income, including dividends and capital gains.
MarketPlus® Investing models consist of institutional quality registered investment companies. Investment values will fluctuate, and shares, when redeemed, may be worth more or less than original cost.
Advisory services are provided by SJS Investment Services, a registered investment advisor (RIA) with the SEC. Registration does not imply a certain level of skill or training. SJS Investment Services does not provide legal or tax advice. Please consult your legal or tax professionals for specific advice.

From Capitol Hill to Main Street: How the Big Beautiful Bill Impacts Your Business
As we discussed in our last blog post, Congress passed the long-anticipated One Big Beautiful Bill Act (OBBBA). True to its name, this legislation covers a wide range of tax and financial provisions. And for business owners in particular, the impact is meaningful [1].
By Senior Advisor Andrew Schaetzke, CFP®
As we discussed in our last blog, Congress passed the long-anticipated One Big Beautiful Bill Act (OBBBA). True to its name, this legislation covers a wide range of tax and financial provisions. And for business owners in particular, the impact is meaningful [1].
We know new legislation brings new questions. That’s why we’ve cut through the fine print and highlighted the updates that matter most for business owners and entrepreneurs. Here are some of the most important features of the bill:
-
The 20% deduction for Qualified Business Income (QBI) under Section 199A is now permanent for pass-through entities. This includes expanded phase-out thresholds for service businesses—and even a $400 minimum deduction for those with at least $1,000 in QBI [6].
Why it matters: This offers long-term planning clarity for LLCs, S Corps, partnerships, and sole proprietors—especially those concerned about prior sunset provisions.
-
The rules for Qualified Small Business Stock (QSBS) under Section 1202 just became more flexible—and more favorable.
50% of gains are excluded if the stock is held for 3+ years
75% of gains are excluded if held for 4+ years
100% exclusion still applies after 5+ years
In addition, two key thresholds have expanded:
The gain exclusion cap is now the lesser of 10x basis or $15 million (up from $10 million), with both figures indexed for inflation
Companies with up to $75 million in assets (up from $50 million) are now eligible [2]
Why it matters: This modernized framework may make QSBS more accessible and more beneficial for founders, early-stage investors, and business owners considering equity-based succession strategies. The new tiered holding periods also allow for partial exclusions on shorter timelines—a notable change from the traditional 5-year requirement.
-
Starting January 19, 2025, 100% bonus depreciation is back for non-real property. The prior phase-down schedule is scrapped [2].
Why it matters: This allows businesses to immediately write off the full cost of qualifying assets, boosting after-tax cash flow and incentivizing investment.
-
100% bonus depreciation now extends to certain production and refining facilities—split proportionally between operational and administrative areas [4].
Why it matters: Capital-intensive industries may see significant tax savings, particularly when upgrading or expanding plant infrastructure.
-
Section 179 limits increased to $2.5 million, with phase-outs starting at $4 million [2].
Why it matters: Small and mid-sized businesses have more flexibility to expense capital investments—without worrying about hitting outdated limits.
-
Domestic research and experimentation costs no longer require amortization, reverting to pre-2017 rules. Businesses may also retroactively expense R&D costs dating back to 2021. (Note: Foreign R&D still requires 15-year amortization.) [3][4]
Why it matters: This is a major win for innovative companies—especially those in engineering, technology, and manufacturing—who have been burdened by post-TCJA amortization rules.
-
Corporations may now only deduct charitable contributions above 1% of taxable income, though the existing 10% cap remains. Unused deductions can be carried forward [3].
Why it matters: This change could alter how C corporations structure philanthropic commitments—especially those with lower taxable income.
-
The excess business loss limitation is no longer temporary. Carryforward rules are clarified and locked in, adding predictability [2].
Why it matters: Business owners facing irregular income years will need to plan carefully—but the permanence of the rule helps with long-term modeling.
-
The pass-through entity tax (PTET) strategy—where states allow entities to pay income tax at the business level—remains intact [2].
Why it matters: This is still a viable workaround for state and local tax (SALT) deduction caps, especially in high-tax jurisdictions.
-
The interest expense limitation is now permanently based on EBITDA, rather than EBIT [2].
Why it matters: This provides more flexibility for capital-intensive businesses, especially those leveraging financing to fund growth.
-
Employee Retention Credit (ERC) claims for Q3 and Q4 of 2021 can no longer be filed after January 31, 2024 [4].
Why it matters: If you missed the deadline, no further claims can be submitted. If you filed already, consult your tax advisor on potential audit exposure.
-
The Opportunity Zone program is now permanent, with a rolling 10-year designation window starting in 2027 [2][5].
Why it matters: This helps create more long-term predictability for tax-deferred (or tax-free) investing in designated areas—potentially aligning with broader growth or real estate strategies.
So What Does This Mean for Business Owners?
Whether you're operating a closely held business, running multiple entities, or preparing for a transition, the long-term clarity in this bill creates real planning opportunities.
From expanded deductions and restored expensing rules to clear guidance on loss limitations and investment incentives, OBBBA offers a more stable tax planning environment.
We’re Here to Help You!
If you’re wondering how these updates may affect your business or personal financial plan, let’s talk. Your SJS advisor is ready to collaborate with your CPA or legal team to help you structure decisions around these new provisions—strategically, and in sync with your broader goals.
Important Disclosure Information & Sources:
“H.R.1 - One Big Beautiful Bill Act”. 119th Congress, 01-Jul-2025, congress.gov.
Mayer Brown, “One Big Beautiful Bill Act Introduces Significant Domestic and International Tax Changes” July 9, 2025.
RSM US, “New Tax Law Introduces Big Changes for Exempt Organizations,” July 14, 2025.
Doeren Mayhew, “Breaking Down ‘The One, Big, Beautiful Bill Act,’” June 10, 2025.
Bi-Pacific (BIPC), “One Big, Beautiful Bill … Simplified,” July 2025.
Tax Foundation, “199A Deduction: Pass-Through Business | Big Beautiful Bill,” June 2025.
There is no guarantee investment strategies will be successful. Past performance is no guarantee of future results. Diversification neither assures a profit nor guarantees against a loss in a declining market.
Advisory services are provided by SJS Investment Services, a registered investment advisor (RIA) with the SEC. Registration does not imply a certain level of skill or training. SJS Investment Services does not provide legal or tax advice. Please consult your legal or tax professionals for specific advice.
Statements contained in this article that are not statements of historical fact are intended to be and are forward looking statements. Forward looking statements include expressed expectations of future events and the assumptions on which the expressed expectations are based. All forward looking statements are inherently uncertain as they are based on various expectations and assumptions concerning future events and they are subject to numerous known and unknown risks and uncertainties which could cause actual events or results to differ materially from those projected.

How To Know A Good Innovation From A Bad One
It’s no secret that the pace of innovation these days is supersonic. We all see the online videos of near-daily rocket launches and miraculous landings. And everyone seems to be asking the same question: how do we discern a good “innovation” from a not-so-good one?
By Founder and CEO Scott J. Savage
It’s no secret that the pace of innovation these days is supersonic. We all see the online videos of near-daily rocket launches and miraculous landings. We witness artificial intelligence (AI) advancements that astound us and, if we’re honest, may make us a little uncomfortable. Everywhere we look, new technology is invading our lives. And everyone seems to be asking the same question: how do we discern a good “innovation” from a not-so-good one?
Throughout our history, embracing innovation and change has been a big part of who we are. In 1940, the Investment Advisors Act was passed, requiring specific investment advisors to register with the SEC and adhere to fiduciary standards.[1] Believe it or not, it took more than fifty years for that new way of doing business to catch on. The registered investment advisor (RIA) model was completely foreign to the broker/dealer, commission-based salespeople who made up most of the industry at the time.
Even though we adopted the RIA model at our founding in 1995, we were among the first. That’s something we’re proud of. Back then, it was still considered a bold move—but we believed it was the right way to serve clients, and we still do.
MarketPlus® Investing has its roots in innovation. Historically, that’s played a role in defining the “Plus.” It’s about looking at the world, the nation, and the financial markets to find the innovations, evaluate them, and decide which ones meet our standards. Few make the cut.
On the plus side, the investment managers we partner with provide us—and therefore you—access to investments most people don’t even know exist. Advancements in technology, the size of SJS, the nature of our clients, and our relationships have opened doors to rare investment opportunities that are off-limits to most firms. Embracing innovation continues to set us apart.
An innovation we’re less favorable about? The trend toward private equity and its impact on our industry. Private equity-backed consolidators are buying up RIA firms at a rapid pace. That’s an innovation that doesn’t interest us in the least. In fact, we see it as a step backward for clients. We assure you that SJS will remain fiercely independent, which means putting your needs—not the interests of outside investors—first.
These are just two examples. The fly on the wall in our office witnesses regular conversations about innovations we find—and that find us. What technologies are a no? What are a wait-and-see? Which ones are a yes? How do we adapt? In every one of those conversations, you are top of mind.
Not all innovation is created equal. The good ones stand the test of time and improve outcomes. The bad ones? They usually reveal themselves soon enough. Our job is to know the difference—so you don’t have to worry about it.
Let’s stay ahead together. Reach out to your advisor anytime to continue the conversation! We’re here to answer your questions and help you stay confidently ahead—no matter what’s coming next.
Important Disclosure Information & Sources:
[1] “Laws and Rules”. U.S. Securities and Exchange Commission, sec.gov.
There is no guarantee investment strategies will be successful. Past performance is no guarantee of future results. Diversification neither assures a profit nor guarantees against a loss in a declining market.
Advisory services are provided by SJS Investment Services, a registered investment advisor (RIA) with the SEC. Registration does not imply a certain level of skill or training. SJS Investment Services does not provide legal or tax advice. Please consult your legal or tax professionals for specific advice.
Statements contained in this report that are not statements of historical fact are intended to be and are forward looking statements. Forward looking statements include expressed expectations of future events and the assumptions on which the expressed expectations are based. All forward looking statements are inherently uncertain as they are based on various expectations and assumptions concerning future events and they are subject to numerous known and unknown risks and uncertainties which could cause actual events or results to differ materially from those projected.

Walking the Tightrope: The Fed, the Market, and Your Bonds
Interest rates don’t always make headlines, but when they do, they tend to shake everything else. That’s because rates sit at the heart of the economy: they influence borrowing costs, savings yields, and business investment.
By Senior Advisor, Director of Institutional Investment Management Kirk Ludwig, AIF®.
Interest rates don’t always make headlines, but when they do, they tend to shake everything else. That’s because rates sit at the heart of the economy: they influence borrowing costs, savings yields, and business investment. When rates rise, borrowing slows down and saving money becomes more attractive. When rates fall, money moves more freely, boosting spending and growth. The Federal Reserve adjusts short-term interest rates to keep this balance in check - more like walking a tightrope than pulling a lever. One wrong step, and they risk leaning too far in either direction.
Lately, that balancing act has gotten tougher. One day, markets are reacting to sticky inflation. The next, it’s fears of slowing growth (i.e., recession). Economic data keeps shifting, headlines flip week to week, and forecasts feel outdated the moment they’re made. With so much in flux, the Fed held interest rates steady at its last meeting, opting to wait for more clarity. Tariffs could end up raising prices and slowing growth at the same time - a combination economists refer to as stagflation. It’s not a word we throw around lightly, but it explains why the Fed isn’t rushing into a decision.[1] Sometimes, staying put is the most thoughtful move.
It’s a challenging environment for policymakers, but it’s just as noisy for investors. And in times like these, clarity isn’t the most realistic goal. Preparation is.
That’s why, at SJS, we don’t try to guess the next move. We focus on building portfolios that can withstand evolving markets. Our fixed income strategy (bonds) is designed for a wide range of outcomes:
Short-duration bonds to help in an environment where prices stay elevated and yields potentially rise.
Inflation-protected bonds to assist in times of unexpected or prolonged inflation.
Longer maturity holdings that benefit if growth slows and yields fall.
A diversified mix of credit bonds, including investment-grade corporate bonds, as well as selectively-chosen high yield bonds and private credit to capture higher yields.
We don’t build portfolios to match the news. We build them to withstand it.
We’ve seen many economic cycles. Each one brings its own uncertainty, but this one feels especially dynamic. With so many moving parts, the outcome may look very different from what anyone expects. That’s why we don’t build portfolios around predictions; rather we build them to adapt. Time and again – we believe thoughtful diversification, discipline, and a clear process prove more effective than chasing headlines.
So yes, the Fed may be walking a tightrope. And yes, markets may stay moody.
But your bond portfolio? That should stay steady.
Important Disclosure Information & Sources:
[1] “Federal Open Market Committee”. Board of Governors of the Federal Reserve System, federalreserve.gov.
There is no guarantee investment strategies will be successful. Past performance is no guarantee of future results. Diversification neither assures a profit nor guarantees against a loss in a declining market.
MarketPlus® Investing models consist of institutional quality registered investment companies. Investment values will fluctuate, and shares, when redeemed, may be worth more or less than original cost.
Statements contained in this report that are not statements of historical fact are intended to be and are forward looking statements. Forward looking statements include expressed expectations of future events and the assumptions on which the expressed expectations are based. All forward looking statements are inherently uncertain as they are based on various expectations and assumptions concerning future events and they are subject to numerous known and unknown risks and uncertainties which could cause actual events or results to differ materially from those projected.

Navigating Market Volatility — SJS Perspective
Given recent price drops in US stocks, we wanted to offer our perspective on why maintaining discipline to target allocations may be one of the most important things we can do as investors.
By Founder & CEO, Scott J. Savage
Given recent price drops in US stocks, we wanted to offer our perspective on why maintaining discipline to target allocations may be one of the most important things we can do as investors.
It’s natural to wonder if moving to cash or otherwise “getting out” of certain investments might help during volatility. While market declines pose a risk, often the greater risk is missing the recovery that follows. Historically, the best days in the market tend to follow the worst, and missing just a handful of those best days can drastically impact long-term returns. Timing the market consistently is nearly impossible, which is why staying invested has been the best approach to ensure that your portfolio is there to capture the recovery when it happens.
Nothing is ever certain, of course, but managing uncertainty by weighing historical evidence has been critical to the success of SJS investment strategies for nearly 30 years.

We understand that volatility can be unsettling, so we want to reassure you:
We expect market fluctuations and plan for them.
We are continuously monitoring opportunities on your behalf.
We remain focused on managing your investments for long-term success.
We are here for you. Please reach out to the SJS Team if a meeting or conversation would be of value.
Very truly yours,
Scott J. Savage
Founder + CEO
Disclosures:
This does not constitute a complete description of our investment services or performance. SJS offers investment advisory services only in states where we are registered, have completed a notice filing or where an exemption or exclusion from such notice filing exists. SJS Investment Services does not provide legal or tax advice. Please contact your legal or tax professionals for specific advice.
There is no guarantee investment strategies will be successful. Past performance is no guarantee of future results. Diversification neither assures a profit nor guarantees against a loss in a declining market. Statements contained in this material that are not statements of historical fact are intended to be and are forward looking statements. Forward looking statements include expressed expectations of future events and the assumptions on which the expressed expectations are based. All forward looking statements are inherently uncertain as they are based on various expectations and assumptions concerning future events and they are subject to numerous known and unknown risks and uncertainties which could cause actual events or results to differ materially from those projected.

The Tale Of Two Curves: What The Yield Curve Means For You
The yield curve isn’t just an academic concept; it impacts real-life decisions.
By Senior Advisor Kirk Ludwig, AIF®.
In September 2024, the Federal Reserve started lowering interest rates after a long stretch of raising them to combat inflation. This marked a notable shift, as the Fed appears to have achieved a soft landing - taming inflation without derailing the economy. But here’s the catch: not all rates have followed suit. In fact, some rates are higher today than they were at the start of the year. Below is a graph of the Treasury yields along the maturity spectrum at the beginning of the year and the end of the year, known as the yield curve, and reflecting the changing market sentiment.

Source: “Daily Treasury Par Yield Curve Rates”. U.S. Department of the Treasury, 02-Jan-2024 through 31-Dec-2024, treasury.gov. See Important Disclosure Information.
At the start of the year, short-term interest rates were elevated due to aggressive Federal Reserve action to manage inflation. Over the year, inflation levels eased, and the Fed shifted to lowering rates, and short-term yields followed. But the longer-term rates have risen, incorporating expectations for growth, inflation, borrowing needs, and many other factors. This divergence tells us something important: while the Fed controls the Fed Funds rate, the market determines all other rates. The front end of the yield curve reflects what the market thinks the Fed will do next, while the back end reflects everything else into the future.
The yield curve isn’t just an academic concept; it impacts real-life decisions. If you’re watching your money market yields, you’ve likely noticed they’ve been dropping. On the other hand, if you’re shopping for a 30-year mortgage, rates have drifted higher. For investors, money market and short-term bonds are experiencing lower yields, while longer-term bonds are paying more income. That’s not to say that you should be shifting everything to longer maturities; it just simply means that the market is pricing future risk differently. Paying attention to maturity terms is critical, and that’s why we focus on the shift in all interest rates - not just the Fed Funds rate.
The yield curve has often been labeled the market’s crystal ball, supposedly predicting recessions and expansions. But a crystal ball might be giving it too much credit. A Magic 8-Ball is probably more fitting - you shake it and get a random answer like “Ask again later” or “Outlook not so good.” What the yield curve does exceptionally well is capture the collective thoughts of the market today. It’s a snapshot, not a prophecy, and tomorrow’s new information could change the picture entirely.
Important Disclosure Information:
There is no guarantee investment strategies will be successful. Past performance is no guarantee of future results. Diversification neither assures a profit nor guarantees against a loss in a declining market.
Statements contained in this article that are not statements of historical fact are intended to be and are forward looking statements. Forward looking statements include expressed expectations of future events and the assumptions on which the expressed expectations are based. All forward looking statements are inherently uncertain as they are based on various expectations and assumptions concerning future events and they are subject to numerous known and unknown risks and uncertainties which could cause actual events or results to differ materially from those projected.
Advisory services are provided by SJS Investment Services, a registered investment advisor (RIA) with the SEC. Registration does not imply a certain level of skill or training. SJS Investment Services does not provide legal or tax advice. Please consult your legal or tax professionals for specific advice.

Election Time
Every four years, we get the same question (whether you have asked it, or you are thinking it) – how will the election affect my portfolio?
By Chief Investment Officer Tom Kelly, CFA.
It is that time again. Political ads inundate your commercial breaks and news feeds. Elections are about a month away, with the focus being the battle for the White House. Every four years, we get the same question (whether you have asked it, or you are thinking it) – how will the election affect my portfolio?
For SJS, this is the eighth time we have been through this cycle and our answer has not changed – we do not know! It is not that we do not care, we just rely on the core fundamentals of MarketPlus® Investing as our guide:
Markets are efficient and are priced fairly.
Speculating is futile.
Global markets have rewarded investors over the long term.
Portfolio design matters most.
The markets – stocks, bonds, real estate, commodities, you name it – are all considering millions of data points, such as growth prospects, geopolitical challenges and opportunities, and yes, even who holds the White House and how that might affect the markets. But all that information is incorporated in the prices, both the prospects of risk and reward. That does not mean that prices are always right, but that you are being fairly compensated for the risk you take. Over time we believe investors are rewarded, and assuming appropriate portfolio design and diversification, this can assist in achieving your investing goals.
As things stand, the election odds for Kamala Harris and Donald Trump are roughly 50% / 50%, but come November 5th, those odds will end at 100% / 0% or 0% / 100% (barring some undetermined swing states). We will likely see some volatility leading up to and potentially even after the election, as markets weigh new developments. Take courage along the way, knowing we have designed your portfolios to navigate any political environment, and we will be there to adjust whenever the time comes.

Source: Morningstar, as of September 30, 2024. There is no guarantee investment strategies will be successful. Past performance is no guarantee of future results. Diversification neither assures a profit nor guarantees against a loss in a declining market. Indices are not available for direct investment. Index performance does not reflect the expenses associated with management of an actual portfolio. Index performance is measured in US dollars. The index performance figures assume the reinvestment of all income, including dividends and capital gains. The S&P 500 Index is a free float-adjusted market-capitalization-weighted index of 500 of the largest publicly traded companies in the United States. See Important Disclosure Information.
Important Disclosure Information:
There is no guarantee investment strategies will be successful. Past performance is no guarantee of future results. Diversification neither assures a profit nor guarantees against a loss in a declining market.
Statements contained in this report that are not statements of historical fact are intended to be and are forward looking statements. Forward looking statements include expressed expectations of future events and the assumptions on which the expressed expectations are based. All forward looking statements are inherently uncertain as they are based on various expectations and assumptions concerning future events and they are subject to numerous known and unknown risks and uncertainties which could cause actual events or results to differ materially from those projected.
Advisory services are provided by SJS Investment Services, a registered investment advisor (RIA) with the SEC. Registration does not imply a certain level of skill or training. SJS Investment Services does not provide legal or tax advice. Please consult your legal or tax professionals for specific advice.

Earning More Interest On Your Cash
While people commonly hold their cash within checking and savings accounts, we want to highlight three short-term, interest-bearing investments that can be held within your investment account.
By Investment Associate Bobby Adusumilli, CFA.
One of our roles as advisors is to look for opportunities to allow your money to work better for you. Cash is often one of the most overlooked assets when it comes to improving someone’s investment returns. People may have large amounts of cash for a variety of reasons: emergency fund, saving for a house down payment, planning to buy a new car, etc. We often see people accumulating cash in their checking account without really thinking about it. Particularly today, with short-term U.S. Treasury bonds paying upwards of 5% interest on an annualized basis, we view this as a missed opportunity to earn more interest.
There are many ways to potentially increase the amount of interest you receive on your cash savings while still investing in something that is low risk and readily transferable to your checking account within a few business days. While people commonly hold their cash within checking and savings accounts, we want to highlight three short-term, interest-bearing investments that can be held within your investment brokerage account:

Sources: Average Interest-Bearing Checking Account and Average Savings Account: "Bankers Resource Center: National Rates and Rate Caps". FDIC, 20-May-2024, fdic.gov. Schwab Value Advantage Money Fund (SWVXX): "Schwab Value Advantage Money Fund® - Investor Shares". Charles Schwab, 31-May- 2024, schwabassetmanagement.com. One-Month Treasury Bill: "Daily Treasury Par Yield Curve Rates". U.S. Department of the Treasury, 31-May-2024, treasury.gov. Dimensional Ultrashort Bond ETF: "DUSB: Ultrashort Fixed Income ETF". Dimensional Fund Advisors, 31-May-2024, dimensional.com. Yield will not necessarily equal realized returns. See Important Disclosure Information.
Money market fund: A mutual fund that continually invests in ultrashort-term (around one-month on average), high-quality bonds. Money market funds accrue interest daily (interest is typically paid monthly) and are not expected to fluctuate in price. As a mutual fund, they are subject to an expense ratio. A good proxy to determine how the interest rate of a money market fund may change over time is to take the interest of a one-month Treasury bill and subtract the expense ratio.
U.S. Treasuries: Treasury bills, notes, and bonds (Treasuries) are issued directly by the U.S. government for terms ranging from one month to thirty years, as detailed in the chart below. They are subject to federal income tax, but not state or local income tax. Treasury bonds are often cheaper to buy and hold than money market funds, though you have to decide what you want to do with the money when the Treasury matures. You can sell Treasuries before they mature, though the value does fluctuate if sold before maturity. You can buy Treasuries through most major investment brokerage platforms including Charles Schwab.
Ultrashort bond ETF: An ETF (exchange traded fund) that continually invests in ultrashort-term, investment-grade bonds. Ultrashort bond ETFs typically range in average maturity from three months to one year. Compared to a money market fund, ultrashort bond ETFs usually invest in slightly longer-term bonds and have more exposure to corporate bonds, though any additional risk is typically accompanied by higher expected interest. Many ultrashort bond ETFs have lower expense ratios than various money market funds. It is important to note that ultrashort bond ETFs will fluctuate in price to some degree.
With interest rates rising over the last few years, we have had a lot of conversations about cash with clients. If you would like to discuss ways you can earn more on your cash, please feel free to reach out to us.

Source: U.S. Department of the Treasury, as of June 30, 2024. See Important Disclosure Information.
Important Disclosure Information:
There is no guarantee investment strategies will be successful. Past performance is no guarantee of future results. Diversification neither assures a profit nor guarantees against a loss in a declining market.
Statements contained in this report that are not statements of historical fact are intended to be and are forward looking statements. Forward looking statements include expressed expectations of future events and the assumptions on which the expressed expectations are based. All forward looking statements are inherently uncertain as they are based on various expectations and assumptions concerning future events and they are subject to numerous known and unknown risks and uncertainties which could cause actual events or results to differ materially from those projected.
Advisory services are provided by SJS Investment Services, a registered investment advisor (RIA) with the SEC. Registration does not imply a certain level of skill or training. SJS Investment Services does not provide legal or tax advice. Please consult your legal or tax professionals for specific advice.

Standing On The Shoulders Of Giants: The Evolution Of MarketPlus® Investing
When working with investment managers, we want them to share that same client-first philosophy and sit on the same side of the table with us.
By Chief Investment Officer Tom Kelly, CFA.
When he founded SJS in 1995, Scott J. Savage set out to provide a major money center management experience while maintaining small town values and putting the client first, all the time, every time. A novel idea back then in a world where the stockbroker business model was (and still is) embedded with conflicts of interest. There had to be a better way, to sit on the same side of the table as our clients and align our interests. It is this founding "first principle" from which everything else flows. And still to this day it allows us to filter everything we do through that same lens. For example, when working with investment managers, we want them to share that same client-first philosophy and sit on the same side of the table with us.
Stone Ridge Asset Management, one of the investment managers we work with, shares similar first principles. Stone Ridge aims to provide investors with access to diversifying investment strategies (such as reinsurance and alternative lending) that have low correlations to global stocks and bonds.[1] Many of these investment strategies have been historically difficult to access for most investors.
The search for investment strategies that perform differently from global stocks and bonds led us to Stone Ridge, but what kept us interested was their alignment with their clients and partners. Stone Ridge founder Ross Stevens studied at the University of Chicago under famed professor Eugene Fama, who won the Nobel Prize in Economic Sciences in 2013. The name Fama may sound familiar, as his market efficiency work has influenced MarketPlus® Investing. However, Stevens believes that Fama’s greater contribution is his work on the principal-agent problem. At many companies, ownership and day-to-day management are mostly separate. This can lead to each side having different information as well as contrasting motivations. As a result, decisions are often made by both ownership and management that are not best for the various stakeholders.
Stone Ridge seeks to minimize the principal-agent problem through partnering with industry leaders, sharing risk directly alongside them (gains and losses), and collaborating using proprietary data and evaluation techniques. Additionally, Stone Ridge employees invest in the various investment strategies, paying full fees like clients do.
In our first meeting with Stevens several years ago, he spoke about Stone Ridge’s culture. He shared insights on the investment strategies, like reinsurance, where they are one of the largest capital providers to reinsurance companies and partnering with them through risk-sharing – sitting on the same side of the table.[2] He then recounted the origin story of Stone Ridge, which is named after the small town in upstate New York that he holds special – all this from his office overlooking Wall Street. Talk about a major money center experience with small town values!
Important Disclosure Information & Sources:
[1] “Strategies”. Stone Ridge Asset Management, stoneridgeam.com.
[2] “Reinsurance”. Stone Ridge Funds, stoneridgefunds.com.
There is no guarantee investment strategies will be successful. Past performance is no guarantee of future results. Diversification neither assures a profit nor guarantees against a loss in a declining market.
Statements contained in this report that are not statements of historical fact are intended to be and are forward looking statements. Forward looking statements include expressed expectations of future events and the assumptions on which the expressed expectations are based. All forward looking statements are inherently uncertain as they are based on various expectations and assumptions concerning future events and they are subject to numerous known and unknown risks and uncertainties which could cause actual events or results to differ materially from those projected.
Advisory services are provided by SJS Investment Services, a registered investment advisor (RIA) with the SEC. Registration does not imply a certain level of skill or training. SJS Investment Services does not provide legal or tax advice. Please consult your legal or tax professionals for specific advice.
Hyperlinks to third-party information are provided as a convenience.

Inside MarketPlus® Investing – Fund Spotlight: SRDAX
SRDAX is a shining example of the value alternatives can bring to traditional stock and bond strategies.
By Founder & CEO Scott J. Savage.
What lights me up and has made our clients money in 2023? Diversified alternatives!
After an extensive year-long due diligence process by our Investment Committee seeking to access additional markets while staying true to the core MarketPlus® Investing philosophy, SJS approved the Stone Ridge Diversified Alternatives Fund (SRDAX) as a potential client investment in December 2021. SRDAX is an open-end mutual fund designed to provide access to five underlying investment strategies that have historically performed differently than global stocks and bonds: reinsurance, market risk transfer, style premia, alternative lending, and single-family rental homes.[1] All of these underlying strategies seek systematic income streams.
Starting in December 2021, we began adding SRDAX to client portfolios that we deemed to be appropriate. As of the end of 2023, the fund finished up over 19% for the year.[2]

Source: Stone Ridge Asset Management. Data from April 30, 2020 (inception of the fund) through December 29, 2023. Total return includes reinvestment of all distributions. Tax implications are not considered. Past performance does not guarantee future results. Short-term results may not be indicative of long-term performance. See Important Disclosure Information.
No investment that purports a return over the risk-free rate will move up consistently, and SRDAX is no different. For example, in November 2023, SRDAX declined almost 1% for the month. It just so happened that coincident with this short-term decline, global stocks and U.S. bonds rallied, up 9.3% and 4.5% respectively in November (as measured by the MSCI All Country World Index and the Bloomberg U.S. Aggregate Bond Index, respectively.)[2]
While November 2023 is anecdotal, we believe it is also evidence that SRDAX returns are not only uncorrelated to the performance of global stocks and bonds, but they are unrelated. Since adding this strategy to our client portfolios, SRDAX has been an excellent diversifier to our MarketPlus® Investing strategies (see table, below). We don’t believe the 2023 pace of return is sustainable due to underlying investment conditions; however, it is a shining example of the value alternatives can bring to traditional stock and bond strategies. Namely, providing expected returns commensurate with the risk that is being assumed while not following the ups and downs of the publicly traded stock and bond markets.

Source: Stone Ridge Asset Management, Morningstar. The MSCI All Country World Index captures large and mid cap representation across 23 developed market and 24 emerging market countries, covering approximately 85% of the global investable equity opportunity set. The Bloomberg U.S. Aggregate Bond Index measures the performance of investment grade, U.S. dollar-denominated, fixed-rate taxable bond market. Indices are not available for direct investment. Index performance does not reflect the expenses associated with management of an actual portfolio. Index performance is measured in US dollars. The index performance figures assume the reinvestment of all income, including dividends and capital gains. Tax implications are not considered. See Important Disclosure Information.
In supplementing traditional bond strategies with an alternative income-seeking strategy, the diversification through SRDAX is as close to a free lunch we have found over the past couple of years. The search for what’s next to add to our MarketPlus® Investing portfolios continues.
Important Disclosure Information & Sources:
[1] Source: Stone Ridge Asset Management.
[2] Source: Morningstar.
Indices are not available for direct investment. Index performance does not reflect the expenses associated with management of an actual portfolio. Index performance is measured in US dollars. The index performance figures assume the reinvestment of all income, including dividends and capital gains.
There is no guarantee investment strategies will be successful. Past performance is no guarantee of future results. Diversification neither assures a profit nor guarantees against a loss in a declining market.
Statements contained in this article that are not statements of historical fact are intended to be and are forward looking statements. Forward looking statements include expressed expectations of future events and the assumptions on which the expressed expectations are based. All forward looking statements are inherently uncertain as they are based on various expectations and assumptions concerning future events and they are subject to numerous known and unknown risks and uncertainties which could cause actual events or results to differ materially from those projected.
MarketPlus® Investing models consist of institutional quality registered investment companies. Investment values will fluctuate, and shares, when redeemed, may be worth more or less than original cost.
Advisory services are provided by SJS Investment Services, a registered investment advisor (RIA) with the SEC. Registration does not imply a certain level of skill or training. SJS Investment Services does not provide legal or tax advice. Please consult your legal or tax professionals for specific advice.
Hyperlinks to third-party information are provided as a convenience.

Growing Your Cash
You can consider putting excess cash into a money market fund, short-term U.S. Treasury bonds, or a short-term bond mutual fund / ETF.
By Chief Investment Officer Tom Kelly, CFA.
Interest rates are up everywhere. Except perhaps your bank account. While the Federal Reserve's rate hikes and skyrocketing mortgage rates dominate headlines, the fine print in your bank account statement, revealing the interest rate on your savings, isn’t making the same amount of noise. Perhaps it should, and for all the wrong reasons.
The national average rate for a bank savings account is a paltry 0.45%, as of September 2023.[1] While these rates have been low for quite some time, there have not been obvious and safe alternatives… until recently! One-month Treasury Bills now yield 5.55% on an annualized basis as of September 29, 2023.[2] Additionally, one-year rates are at 5.46% as of September 29, 2023.[3] These are short-term rates we haven’t seen in over 20 years.

See Important Disclosure Information.[1][2][3]
One of the key roles of an advisor is to identify opportunities in the market. And while they don’t always exist, or persist, we believe that this is an important area to pick up yield if you have excess cash on the side. You can consider putting that excess cash into a higher-yield money market fund, short-term U.S. Treasury bonds, or a short-term bond mutual fund / ETF. Please reach out to us to discuss the best options for your situation.
Important Disclosure Information & Sources:
[1] “National Deposit Rates: Savings, Percent, Monthly, Not Seasonally Adjusted”. FRED, September 2023, fred.stlouisfed.org.
[2] “Market Yield on U.S. Treasury Securities at 1-Month Constant Maturity, Quoted on an Investment Basis, Percent, Monthly, Not Seasonally Adjusted”. FRED, September 2023, fred.stlouisfed.org.
[3] “Market Yield on U.S. Treasury Securities at 1-Year Constant Maturity, Quoted on an Investment Basis, Percent, Monthly, Not Seasonally Adjusted”. FRED, September 2023, fred.stlouisfed.org.
There is no guarantee investment strategies will be successful. Past performance is no guarantee of future results. Diversification neither assures a profit nor guarantees against a loss in a declining market.
Advisory services are provided by SJS Investment Services, a registered investment advisor (RIA) with the SEC. Registration does not imply a certain level of skill or training.
Hyperlinks to third-party information are provided as a convenience.

In The Hopes Of A "Soft Landing", There May Be A Crack In The Foundation
The future of the housing market is uncertain, and its resilience will be a crucial factor in the broader economic landscape.
By Chief Investment Officer Tom Kelly, CFA.
The housing market is often viewed as a cornerstone of financial stability. The home signifies a sanctuary, a place where one can relax, enjoy, live, and grow. In the 2008 housing crisis, we experienced how fragile the economy can be when the cornerstone is shaken. While global stock markets have broadly recovered since high inflation and fed rate hikes caused a recessionary scare last year, the housing market has continued to face seismic shifts that may put the chances of a so called “soft landing” on shaky grounds.[1]
In 2023, mortgage rates reached heights not seen in two decades, with the 30-year fixed rate mortgage average hitting a recent high of 7.31% in September.[2] At the same time, potential homebuyers found themselves in a daunting landscape with the number of homes for sale dwindling to 1.1 million as of August, with inventory over the last couple years reaching the lowest levels since 1982.[3] In stark contrast to the pre-pandemic era, there are now only around two-thirds as many homes available on the market.[3] With mortgage demand hitting a 26-year low in September, largely due to the scarcity of available housing inventory and little incentive to refinance, there doesn't appear to be much opportunity for those looking to make a move.[4]

Source: “30-Year Fixed Rate Mortgage Average in the United States”. Federal Reserve Bank of St. Louis, 1971-2023, fred.stlouisfed.org. See Important Disclosure Information.
But the challenges don't stop there. Rental prices have also seen a steady rise. The average rent for primary residences in U.S. cities remains 7.8% higher than a year ago as of August.[5] These elevated rental levels represent the most significant increases we've witnessed since the early 1980s.[5] Additionally, the Federal Reserve Bank of Atlanta estimates that the amount of income the median household needs to spend yearly in order to own a median priced home in the U.S. is 43.8% as of July, significantly higher than the 28.5% amount in December 2019.[6] While many homeowners are locked in to 3-4% mortgages, the next generation of buyers and families may be renting for a little while longer.
The various factors contributing to these unsettling trends in the housing and rental markets are multifaceted and complex. Markets tend not to like extremes, and the quest for stability and security in housing has become more elusive. The future of the housing market is uncertain, and its resilience will be a crucial factor in the broader economic landscape.
Important Disclosure Information & Sources:
[1] “SJS Weekly Market Update”. SJS Investment Services, sjsinvest.com.
[2] “30-Year Fixed Rate Mortgage Average in the United States”. Federal Reserve Bank of St. Louis, 1971-2023, fred.stlouisfed.org.
[3] “United States Total Housing Inventory”. Trading Economics, 1982-2023, tradingeconomics.com.
[4] “Mortgage Applications”. Mortgage News Daily, 1991-2023, mortgagenewsdaily.com.
[5] “Consumer Price Index for All Urban Consumers: Rent of Primary Residence in U.S. City Average”. Federal Reserve Bank of St. Louis, 1915-2023, fred.stlouisfed.org.
[6] “Home Ownership Affordability Monitor (HOAM)”. Federal Reserve Bank of Atlanta, 2023, atlantafed.org.
There is no guarantee investment strategies will be successful. Past performance is no guarantee of future results. Diversification neither assures a profit nor guarantees against a loss in a declining market.
Statements contained in this article that are not statements of historical fact are intended to be and are forward looking statements. Forward looking statements include expressed expectations of future events and the assumptions on which the expressed expectations are based. All forward looking statements are inherently uncertain as they are based on various expectations and assumptions concerning future events and they are subject to numerous known and unknown risks and uncertainties which could cause actual events or results to differ materially from those projected.
Hyperlinks to third-party information are provided as a convenience.

Unexpected Good News: Market Performance So Far In 2023
It’s important to recognize how difficult it is to predict what will happen in the short-term for investment markets, and how much margin for error there should be for any prediction.
By Chief Investment Officer Tom Kelly, CFA.
If you looked at economic and market forecasts at the beginning of the year, you may have expected a lot of volatility and negative returns in stock and bond markets for 2023. For example, the headline for J.P. Morgan’s 2023 Market Outlook is, "Stocks Set to Fall Near-Term as Economic Growth Slows".[1] Additionally, on the first page of UBS' 2023 US Equities Outlook, UBS writes, "With pressure on corporate profits for the next few quarters, equity markets could slip in the near term. However, the outlook should improve later in the year and into 2024."[2]
Contrary to these headlines, most global stock and bond markets are up to start 2023. While some markets (like U.S. bonds) are modestly positive based on their increased yields, others (such as U.S. stocks) are up significantly more than even we could have reasonably optimistically expected. We have experienced a lot of events to start 2023 (persisting core inflation, U.S. debt ceiling negotiations, the expansion of artificial intelligence, corporate job layoffs, etc.), and it would have been difficult for us to predict this market performance given these events. While it is easy to look back at the headlines from the beginning of 2023 and point toward their inaccuracies, it’s important to recognize how difficult it is to predict what will happen in the short-term for investment markets, and how much margin for error there should be for any prediction.

Source: Morningstar, as of June 30, 2023. The asset classes are represented by the following indices: U.S. Stocks - Russell 3000 Index (measures performance of the 3,000 largest U.S. companies representing roughly 96% of the investable U.S. stock market); International Stocks - MSCI All Country World Ex USA IMI Index (Gross Div.) (measures performance of approximately 99% of the global stock opportunity set outside of the U.S.); U.S. Bonds - Bloomberg U.S. Aggregate Bond Index (tracks performance of the U.S. investment-grade bond market); International Bonds - Bloomberg Global Aggregate Ex-USD Bond Index (Hedged To USD) (measures the performance of international investment grade bonds, with currency exposure hedged to the U.S. dollar); Global Real Estate - S&P Global REIT Index (Gross Div.) (tracks performance of publicly traded equity REITS globally). The index performance figures assume the reinvestment of all income, including dividends and capital gains. See Important Disclosure Information.
When it comes to investment markets, it’s easy to look back positively on the past and worry about the future. This is part of human nature, written about extensively through research on biases such as the availability bias (over-emphasizing news that is readily available to us) and negativity bias (focusing on negative aspects of a situation). This makes sense, because most people are more negatively impacted by losses than they are positively impacted by gains.[3] But we’re always here to help take the worry away!
Over the long-term, we expect positive returns from global stock, bond, and alternative markets. Positive returns will not occur every year, but over a long enough time period, we expect these asset classes to continue to have positive returns.[4] We don’t know what will happen for the rest of 2023 or even in the coming years, but we remain optimistic about investment returns over the long term for the future. Staying invested and remaining disciplined in your investment allocation is often the best way to avoid psychological pitfalls and achieve your desired outcomes.
Important Disclosure Information & Sources:
[1] “2023 Market Outlook: Stocks Set to Fall Near-Term as Economic Growth Slows”. J.P. Morgan, 05-Jan-2023, jpmorgan.com.
[2] “US equities 2023 outlook: From inflation to growth“. UBS, 16-Dec-2022, ubs.com.
[3] Thinking, Fast and Slow. Daniel Kahneman, 2011, Farrar, Straus and Giroux.
[4] "Historical Returns on Stocks, Bonds and Bills: 1928-2022". Aswath Damodaran, January 2023, stern.nyu.edu.
There is no guarantee investment strategies will be successful. Past performance is no guarantee of future results. Diversification neither assures a profit nor guarantees against a loss in a declining market.
Statements contained in this report that are not statements of historical fact are intended to be and are forward looking statements. Forward looking statements include expressed expectations of future events and the assumptions on which the expressed expectations are based. All forward looking statements are inherently uncertain as they are based on various expectations and assumptions concerning future events and they are subject to numerous known and unknown risks and uncertainties which could cause actual events or results to differ materially from those projected.
Indices are not available for direct investment. Index performance does not reflect the expenses associated with management of an actual portfolio. Index performance is measured in US dollars. The index performance figures assume the reinvestment of all income, including dividends and capital gains.
Advisory services are provided by SJS Investment Services, a registered investment advisor (RIA) with the SEC. Registration does not imply a certain level of skill or training. SJS Investment Services does not provide legal or tax advice. Please consult your legal or tax professionals for specific advice.
Hyperlinks to third-party information are provided as a convenience.

Tomorrow's Headlines Today
The market’s reaction to tech in the first quarter is another reminder of how hard it is to time and predict the market, even if you “know” what is going to happen.
By Chief Investment Officer Tom Kelly, CFA.
What if you could get the headlines of the market before everyone else? Do you think it would make you a better investor? Provide you with an edge to get that “superior return” you’ve always wanted? In some cases, perhaps, but in others, I suspect the market’s ability to move unexpectedly could leave you worse off.
What if I told you at the beginning of the year that the largest tech companies would continue their string of layoffs, the bank most tied to serving Silicon Valley technology firms would suffer a bank run and collapse, and central bankers would continue to raise interest rates? Would you have guessed the technology sector in the global stock market (as measured by the MSCI All Country World Index (Gross Div.)) would be up over 20%? Doubtful.

Source: Morningstar, as of March 31, 2023. The MSCI ACWI Index is a free float-adjusted market capitalization weighted index designed to measure the equity market performance of developed and emerging markets, consisting of 47 country indices comprising 23 developed and 24 emerging market country indices. Indices are not available for direct investment. Index performance does not reflect the expenses associated with management of an actual portfolio. Index performance is measured in US dollars. The index performance figures assume the reinvestment of all income, including dividends and capital gains. See Important Disclosure Information.
Certainly, there are other factors at play than the ones above (the expectation of an end to Fed interest rate hikes is likely a large contributor to technology outperformance), but that’s how the market operates. The variables we think matter often don’t (or matter less), and outside events often disrupt or complement even the most well researched thesis.
The market’s reaction to tech in the first quarter is another reminder of how hard it is to time and predict the market, even if you “know” what is going to happen. The moral of the story is that we need to remain diversified and invested, even if we think we know how the story might end.
Important Disclosure Information:
There is no guarantee investment strategies will be successful. Past performance is no guarantee of future results. Diversification neither assures a profit nor guarantees against a loss in a declining market.
Advisory services are provided by SJS Investment Services, a registered investment advisor (RIA) with the SEC. Registration does not imply a certain level of skill or training. SJS Investment Services does not provide legal or tax advice. Please consult your legal or tax professionals for specific advice.
Statements contained in this report that are not statements of historical fact are intended to be and are forward looking statements. Forward looking statements include expressed expectations of future events and the assumptions on which the expressed expectations are based. All forward looking statements are inherently uncertain as they are based on various expectations and assumptions concerning future events and they are subject to numerous known and unknown risks and uncertainties which could cause actual events or results to differ materially from those projected.
Hyperlinks to third-party information are provided as a convenience.

The Not So Wonderful Bank Run
On the recent bank distress and investment markets.
“I’ve never really seen one, but that’s got all the earmarks of a run.”
The events of this last week reminded me of that famous scene from It’s a Wonderful Life. When my wife asked what was happening in layman’s terms, I said, “It’s like the It’s a Wonderful Life bank run scene, but with venture-backed startups instead of Bedford Falls’ residents and houses.”
“You’re thinking of this place all wrong. As if I had the money back in a safe. The money’s not here.”
Depositors hold money in a bank for perceived security and to earn interest on their money. Banks then lend out the deposited money, or in some cases, purchase high-quality securities when they are unable to originate enough loans. Loans are often held at book value, or the price it was issued at, and thus are considered held-to-maturity (HTM) assets. While held-to-maturity securities may have unrealized losses, banks typically have other sources of liquidity and likely won’t need to sell them prior to maturity (as the name implies).
“Your money’s in Joe’s house, right next to yours. And in the Kennedy house, and Mrs. Macklin’s house, and a hundred others. Why, you’re lending them the money to build, and then, they’re going to pay it back to you as best they can.”
During the COVID crisis, bank deposits shot up to historic levels, due in-part to both the massive government stimulus as well as cutbacks on expenditures for both households and organizations.[1] It takes time for banks to originate loans, and banks were often unable to put these deposits to work for them in such a short period. As a result, banks broadly increased their securities portfolios, buying Treasury securities, mortgage-backed securities, and other assets that were sensitive to interest rates, hoping to earn a yield.[2] Pair that with the sharp rise in interest rates throughout the past 18 months (generally, as interest rates rise, existing bond prices fall), and many banks marked large unrealized losses on their securities holdings, particularly on bonds with longer maturities / durations.[3] The unrealized losses were not only unprecedented from a historical context, but also happened concurrently with negative deposit growth as depositors left banks to seek higher yields elsewhere.[1][4]

Source: “Deposits, All Commercial Banks“. Federal Reserve Bank of St. Louis, 15-Mar-2023, fred.stlouisfed.org.
“I got two hundred and forty-two dollars in here, and two hundred and forty-two dollars isn’t going to break anybody.”
The psychology of a bank run has similarities to the Prisoner’s Dilemma, where cooperation leads to a mutually beneficial albeit slightly suboptimal outcome, but self-interested action from all parties leads to mutual destruction.[5] As depositors take their funds from a bank, part of that bank’s funding goes away, forcing them to sell assets. The Bailey Building and Loan (from It’s a Wonderful Life) nearly went under, had it not been for the honeymoon savings and the kindness of the depositors to take only what they needed.
Contrarily, the depositors at Silicon Valley Bank (SVB) weren’t quite as patient, and nearly caused a collapse of the entire bank.[6] In It’s a Wonderful Life, the Baileys were able to survive the day and close up shop, but in the era of digital banking and instant money movement (not necessarily bad things), SVB depositors could withdraw all their money with a click of a button instead of waiting in line. Fortunately for SVB depositors, they were backstopped by the Federal Deposit Insurance Corporation (FDIC) beyond just the $250,000 insurance, and the FDIC took over leadership of SVB as an FDIC-operated ‘bridge bank’.[7]
“We made it! Look, (as George holds up two bills) look, we’re still in business!”
While a massive crisis seems to be averted, at least for now, the overall dilemma has not been solved by the Federal Reserve’s intervention in recent weeks. While SVB had a concentration of depositors in the venture and technology space, and likely had mismanaged risk by buying too many long-dated securities, the asset-liability balancing act is the core tenant for how a bank works. Trust in the system and rational behavior is ultimately what keeps the banks solvent.
That does not mean that you should rush to the bank, pull out all your money, and stuff it under the mattress. The FDIC for bank accounts and Securities Investor Protection Corporation (SIPC) for brokerage accounts provide moderate levels of insurance.[8][9] Nevertheless, sound financial management from both the banks and depositors as well as regulatory protections are vital.
For example, Charles Schwab - one of our preferred custodians for client assets - has both banking and brokerage businesses, which are required to be held separately.[10] Their brokerage assets are segregated from Schwab assets, and are not comingled with assets at Schwab’s bank.[11] Customer securities - such as mutual funds and ETFs - are segregated in compliance with the SEC's Customer Protection Rule and protected against creditors’ claims.[11] There are also reporting and auditing requirements in place by government regulators. As a result, we believe that there are prudent risk management policies and practices in place at Schwab that help to limit the risk of what happened at Silicon Valley Bank.
We understand the events of the last week may have led to questions, and we are always willing lend an ear and discuss any concerns.
Important Disclosure Information & Sources:
[1] “Deposits, All Commercial Banks“. Federal Reserve Bank of St. Louis, 15-Mar-2023, fred.stlouisfed.org.
[2] “Treasury and Agency Securities, All Commercial Banks“. Federal Reserve Bank of St. Louis, 15-Mar-2023, fred.stlouisfed.org.
[3] “Federal Funds Effective Rate“. Federal Reserve Bank of St. Louis, 15-Mar-2023, fred.stlouisfed.org.
[4] “Historical Returns on Stocks, Bonds and Bills: 1928-2022“. New York University - Stern School of Business, 15-Mar-2023, stern.nyu.edu.
[5] “Prisoner’s Dilemma“. Stanford Encyclopedia of Philosophy, 02-Apr-2019, plato.stanford.edu.
[6] “What Happened With Silicon Valley Bank?“ Telis Demos, 14-Mar-2023, wsj.com.
[7] “FDIC Acts to Protect All Depositors of the former Silicon Valley Bank, Santa Clara, California“. The Federal Deposit Insurance Corporation, 13-Mar-2023, fdic.gov.
[8] “Deposit Insurance“. The Federal Deposit Insurance Corporation, 15-Mar-2023, fdic.gov.
[9] “What SIPC Protects“. Securities Investor Protection Corporation, sipc.org.
[10] “About Schwab - What We Do”. Charles Schwab Corporation, aboutschwab.com.
[11] “Your assets are protected at Schwab“. Charles Schwab Corporation, schwab.com.
There is no guarantee investment strategies will be successful. Past performance is no guarantee of future results. Diversification neither assures a profit nor guarantees against a loss in a declining market.
Advisory services are provided by SJS Investment Services, a registered investment advisor (RIA) with the SEC. Registration does not imply a certain level of skill or training. SJS Investment Services does not provide legal or tax advice. Please consult your legal or tax professionals for specific advice.
Statements contained in this report that are not statements of historical fact are intended to be and are forward looking statements. Forward looking statements include expressed expectations of future events and the assumptions on which the expressed expectations are based. All forward looking statements are inherently uncertain as they are based on various expectations and assumptions concerning future events and they are subject to numerous known and unknown risks and uncertainties which could cause actual events or results to differ materially from those projected.
Hyperlinks to third-party information are provided as a convenience.

What A Difference A Year Makes: Bonds
For 2022, the bond asset class started the year with extremely low yields and less desirable return expectations. Going into 2023, the higher yields provide bond investors with a brighter outlook!
By Senior Advisor Kirk Ludwig, CFIP, AIF®.
The past year presented the financial markets with high volatility and change. Many of the imbalances caused by the pandemic continued to disrupt segments of the global economy and markets. From inflation soaring to a multi-decade high of 9% in June 2022, to lumber prices plummeting by nearly 65%, to global stocks trading in bear market territory for much of the year, volatility was widespread throughout financial markets.[1][2][3]
Given the complexity of the economic landscape, and the higher uncertainty that came with it, the volatility was not unusual from a historical perspective. However, one market that DID surprise many investors was the U.S. bond market. As one of the largest and most heavily traded financial markets in the world, the U.S. bond market was caught off guard as the Federal Reserve ramped up its campaign to battle inflation by aggressively raising short-term interest rates.[4]
The following chart puts perspective on the changes in Treasury rates across the yield curve. The one-year U.S. Treasury note started the year yielding 0.39% and ended with a yield of 4.73%. As illustrated, it wasn’t just short-term rates that were impacted - rates for all other maturities across the yield curve rose as well.

Source: “Daily Treasury Par Yield Curve Rates“. U.S. Department of the Treasury, treasury.gov.
It's not uncommon for the Federal Reserve to raise or lower interest rates to control economic growth and inflation. However, in this case, the surprise was the speed and magnitude of the rate hikes. With the starting point of short-term interest rates near 0%, bonds didn’t stand much of a chance to generate enough income to offset the change in prices associated with the rapid increase in yields. As a result, the general U.S. bond market suffered one of its worst years in recorded history.[5]
There is a silver lining to higher yields! Over the past decade, conservative investors holding short-term bonds, CDs, money market vehicles, or cash in checking & savings accounts have suffered historically low returns.[6] Now, the spike in interest rates is providing yields on conservative ultra-short-term investments such as one-month Treasury bills at 4% or better. Those willing to extend Treasury maturities to a year can expect to see yields north of 4.5%.
As the Federal Reserve continues its mission of driving inflationary pressures lower, while attempting to avoid a recession, the Fed may continue to raise interest rates further in the near future. We believe further interest rate increases are less concerning compared to a year ago because the risk and return tradeoffs are more favorable for bond investors today.
At SJS, we are consistently monitoring all segments of the markets and assessing the risk and return characteristics of each asset class. For 2022, the bond asset class started the year with extremely low yields and less desirable return expectations. Going into 2023, the higher yields provide bond investors with a brighter outlook!
Important Disclosure Information & Sources:
[1] “Consumer Price Index for All Urban Consumers: All Items in U.S. City Average“. Federal Reserve Bank of St. Louis, fred.stlouisfed.org.
[2] “Lumber (LBS)". Nasdaq, nasdaq.com.
[3] “SJS Weekly Market Update“. SJS Investment Services, 2022, sjsinvest.com.
[4] “Money, Banking, & Finance“. Federal Reserve Bank of St. Louis, fred.stlouisfed.org.
[5] The general U.S. bond market is represented by the Bloomberg U.S. Aggregate Bond Index, which measures the performance of investment grade, U.S. dollar-denominated, fixed-rate taxable bond market. Data source: Morningstar, 1976-2022.
[6] “Interest Rates“. Federal Reserve Bank of St. Louis, fred.stlouisfed.org.
There is no guarantee investment strategies will be successful. Past performance is no guarantee of future results. Diversification neither assures a profit nor guarantees against a loss in a declining market.
Statements contained in this article that are not statements of historical fact are intended to be and are forward looking statements. All forward looking statements are inherently uncertain as they are based on various expectations and assumptions concerning future events and they are subject to numerous known and unknown risks and uncertainties which could cause actual events or results to differ materially from those projected.
Indices are not available for direct investment. Index performance does not reflect the expenses associated with management of an actual portfolio. Index performance is measured in US dollars. The index performance figures assume the reinvestment of all income, including dividends and capital gains.
Advisory services are provided by SJS Investment Services, a registered investment advisor (RIA) with the SEC. Registration does not imply a certain level of skill or training. SJS Investment Services does not provide legal or tax advice. Please consult your legal or tax professionals for specific advice.
Hyperlinks to third-party information are provided as a convenience.

5 Investing Lessons Learned & Re-learned In 2022
The end of the year provides a great time for us to reflect on recent experience to divine lessons to help us going forward.
By Chief Investment Officer Tom Kelly, CFA & Investment Associate Bobby Adusumilli, CFA.
The end of the year provides a great time for us to reflect on recent experience to divine lessons to help us going forward. We want to highlight five lessons that we have learned and re-learned throughout 2022.
Volatility Can Happen Quickly
From a year-to-date performance perspective through November, 2022 has been the worst year for global stocks since the Great Recession from 2007-2009.[1] After more than a decade of positive performance, we knew that global stocks (as measured by the MSCI All Country World Index (ACWI)) having a down year was entirely possible.[1] What has been particularly unusual about 2022 is that U.S. bonds (as measured by the Bloomberg U.S. Aggregate Bond Index) have experienced their worst calendar year performance in the history of the index going back to 1976.[2]
Stock market volatility is to be expected - it is one of the trade-offs in pursuing higher expected returns, as this graph demonstrates:[1]

Source: Morningstar, as of November 30, 2022. Returns are based on total return of the MSCI All Country World Index, which is a free float-adjusted market capitalization weighted index designed to measure the equity market performance of developed and emerging markets. Intra-year drops refers to the largest market drops from a peak to a trough during the year. For illustrative purposes only. See Important Disclosure Information.[1]
In comparison, bond markets typically have much lower volatility than stocks. However, due to higher-than-expected inflation in 2022, the U.S. Federal Reserve has raised interest rates dramatically throughout 2022, which has led to an upward shift in interest rates across maturities:[2][3]

Source: Department of U.S. Treasury, as of November 30, 2022. See Important Disclosure Information.
As a consequence of the rapid increase in U.S. interest rates, existing U.S. investment grade bonds have had to decline in price in order to compensate prospective investors to buy existing bonds versus new bonds with higher interest rates. This is partially why the U.S. investment grade bond market has suffered this year:[2]

Source: Morningstar, as of November 30, 2022. Returns are based on total return of the Bloomberg US Aggregate Bond Index, which is a broad base, market capitalization-weighted bond market index representing intermediate term investment grade bonds traded in the United States. Intra-year drops refers to the largest market drops from a peak to a trough during the year. For illustrative purposes only. See Important Disclosure Information.[2]
Unfortunately, it is very difficult to know when volatility will occur and what changes to make to investment portfolios ahead of time. While sometimes client portfolios experience short-to-medium-term pain, we believe that strategically designing portfolios for the long-term is most likely to benefit the majority of our clients.
For Investment-Grade Bonds, Duration Is Critical
While current yield is a good predictor of return for investment-grade bonds over their maturities (which tend to be higher-quality bonds with low expected risk of default), duration is the most important factor that influences investment-grade bond prices over the short-term.[4] Duration measures a bond portfolio’s price sensitivity to interest rate changes. Because interest rates have risen dramatically throughout 2022, higher-duration bonds have experienced significantly worse performance than shorter-duration bonds in 2022:

Sources: Morningstar, S&P as of November 30, 2022. Duration measures a bond’s or fixed income portfolio’s price sensitivity to interest rate changes. The S&P indices are broad, comprehensive, market-value weighted indices that seeks to measure the performance of their respective markets. See Important Disclosure Information.
Given recent performance, you may be wondering: if the U.S. Treasury yield curve is nearly flat, meaning investors are getting paid nearly the same interest regardless of maturity, why would you buy longer-term bonds? There are two important factors to consider:
The future is uncertain. It is very difficult to predict how interest rates will change relative to what the market is already pricing in. With longer-duration investment grade bonds currently yielding higher than the market’s priced-in expected inflation rates, we think it makes sense for long-term investors to have some exposure to longer-duration bonds.[5][6] Additionally, shorter-duration bonds have reinvestment risk, meaning that if interest rates have fallen by the time the bond matures, then new bonds may have to be purchased at lower interest rates. Longer-maturity investment grade bonds can allow you to “lock-in” an interest rate for longer.
If / when the U.S. Federal Reserve reduces interest rates, longer-duration bonds will likely benefit more in price compared to shorter-duration bonds.
As investment advisors, we continuously monitor duration and credit quality across the bond investments that we recommend. While this year has been rough, we believe the outlook is significantly brighter for bond investors.
Alternatives Are Becoming More & More Important
Alternative investments include asset classes that behave differently than publicly-traded stocks and bonds. Some of these asset classes include private equity, private debt, real estate, infrastructure, natural resources, insurance / reinsurance, and other more complex trading strategies.
High-quality alternative investments have historically been primarily offered to ultra-high net worth institutions and families. Many of the world’s top investors have had significant allocations to alternatives for decades.[7] With advances in investment technology, more and more investors now have access to alternative investments. As a result, the demand for alternative investments is expected to increase in the coming years.
Alternative investments have important tradeoffs to consider. They typically cost more in fees, are more complex, and are less transparent compared to publicly-traded stocks and bonds. Additionally, alternative investments often have lock-up periods, tax inefficiencies, and usually involve more account management. As a result, it is critical to do thorough due diligence before choosing an alternative investment.
In late 2021, SJS added the Stone Ridge Diversified Alternatives Fund (SRDAX) to MarketPlus Investing models.[8][9] While the timing was fortunate given the recent struggles of publicly-traded stocks and bonds, we believe that alternative investments can provide meaningful diversification benefits to client portfolios over the long-term.[8] We are focusing most of our investment research and due diligence efforts on alternatives, with the hope of finding more beneficial investments for our clients.
There Is Always Something Smart To Do
Even when stocks and bonds are struggling, there are smart things that investors can do to potentially help their investment portfolios over time:
Rebalancing means selling investments that are higher than your target allocations, and buying investments that are under-allocated, with the goal of maintaining your target level of risk.
Tax loss harvesting for taxable accounts allows for realized net capital losses to be used to offset current / future capital gains, sell investments that you no longer want to hold, and offset up to $3,000 of your federal taxable income for the current year and future years.
Adding to investments that have attractive expected risk/return characteristics. For example, we believe that allocating to what we think are high-quality alternative investments may be able to help client portfolios over time, though there are no guarantees. Additionally, we previously wrote about Series I Savings Bonds, which are bonds offered by the U.S. government that pay you interest based on the CPI-U inflation index.
Revisiting asset location, which involves placing the most tax-inefficient investments in tax-advantaged accounts. For example, most alternative investments tend to be tax-inefficient, paying high amounts of dividends, interest, and capital gains. Therefore, we have prioritized placing these alternative investments within tax-advantaged client accounts when possible.
Long-Term Investors Have An Advantage
One theme that shows up over and over again in research and our experience with clients is that investors with long time horizons (10+ years) have an advantage over those with short time horizons (<5 years) when it comes to withstanding volatility in order to capture market performance over time.[10][11] Beyond just their time horizon, we have found that investors who are able to keep recent events within perspective of long-term history are better able to stay committed to their investment plan even in the midst of difficulty. For example, despite experiencing 15 recessions, societal changes, and periods of political difficulties, the U.S. stock market (as measured by the S&P 500) has still grown over 10,000-times its initial value from January 1926 through November 2022, as depicted in this graph:

-Sources: NBER, Morningstar, as of November 30, 2022. Recession start and end dates are based on the US Business Cycle Expansions and Contractions data from the NBER. Gray shaded areas represent periods of recession. The S&P 500 Index is a free float-adjusted market-capitalization-weighted index of 500 of the largest publicly traded companies in the United States. The S&P 500 total return index assumes reinvestment of all distributions. See Important Disclosure Information.
While there are no guarantees that the stock market going forward will experience positive performance like the past, we believe in the global economy and innovation. As a result, we believe that stocks and bonds can continue to provide positive returns over the next 10+ years on average, though volatility will cause year-to-year performance differences. While nothing is certain, we are optimistic about the future.
Important Disclosure Information & Sources:
[1] Source: Morningstar, Dimensional Returns Web, as of November 30, 2022. The MSCI ACWI Index is a free float-adjusted market capitalization weighted index designed to measure the equity market performance of developed and emerging markets.
[2] Source: Morningstar, Dimensional Returns Web, as of November 30, 2022. The Bloomberg US Aggregate Bond Index is a broad base, market capitalization-weighted bond market index representing intermediate term investment grade bonds traded in the United States.
[3] “Consumer Price Index for All Urban Consumers: All Items in U.S. City Average“. Federal Reserve Bank of St. Louis, 30-Nov-2022, fred.stlouis.org.
[4] “SJS 2021 Capital Markets Expectations: Making Sense Of The Future“. SJS Investment Services, 04-Feb-2021, sjsinvest.com.
[5] “5-Year Breakeven Inflation Rate“. Federal Reserve Bank of St. Louis, 30-Nov-2022, fred.stlouis.org.
[6] “10-Year Breakeven Inflation Rate“. Federal Reserve Bank of St. Louis, 30-Nov-2022, fred.stlouis.org.
[7] Pioneering Portfolio Management: An Unconventional Approach to Institutional Investment. David Swensen, 2009, Free Press.
[8] “Stone Ridge Diversified Alternatives Fund“. Stone Ridge Asset Management, stoneridgefunds.com.
[9] MarketPlus Investing® models consist of institutional quality registered investment companies. Investment values will fluctuate, and shares, when redeemed, may be worth more or less than original cost. There are limitations inherent in model allocations. In particular, model performance may not reflect the impact that economic and market factors may have had on the advisor's decision making if the advisor were actually managing client money. Not to be construed as investment advice.
[10] “Quantitative Analysis of Investor Behavior“. DALBAR, dalbar.com.
[11] “Are Stocks Riskier Than Bonds?“ Bobby Adusumilli, 07-May-2021, sjsinvest.com.
There is no guarantee investment strategies will be successful. Past performance is no guarantee of future results. Diversification neither assures a profit nor guarantees against a loss in a declining market.
Statements contained in this article that are not statements of historical fact are intended to be and are forward looking statements. All forward looking statements are inherently uncertain as they are based on various expectations and assumptions concerning future events and they are subject to numerous known and unknown risks and uncertainties which could cause actual events or results to differ materially from those projected.
Indices are not available for direct investment. Index performance does not reflect the expenses associated with management of an actual portfolio. Index performance is measured in US dollars. The index performance figures assume the reinvestment of all income, including dividends and capital gains.
Advisory services are provided by SJS Investment Services, a registered investment advisor (RIA) with the SEC. Registration does not imply a certain level of skill or training. SJS Investment Services does not provide legal or tax advice. Please consult your legal or tax professionals for specific advice.
Hyperlinks to third-party information are provided as a convenience.

The Gold Rush?
History has shown that over long periods of time, gold has often failed to outpace inflation, even before considering fees.
By Chief Investment Officer Tom Kelly, CFA.
We all like to consider ourselves investors, but sometimes find ourselves speculators. It can be exciting to predict, tinker, and attempt to outsmart, trying to find the golden opportunities to strike it big. Sometimes it pays off, but many times it leaves us emptyhanded. Good investing is often boring: global diversification in cash flow-producing companies; holding for the long-term; patience in valuations. Anyone can do that, right? Many can, but few do.
Take, for example, the parties in the California Gold Rush of the mid-1800s. Prospectors from all over the world went to California with the hopes of finding that illustrious metal; few made it big, while most ended up with nothing.[1] However, retailers selling the prospecting supplies, merchants, and transporters benefited greatly from the growth of the economy. Samuel Brannan was said to be the wealthiest man in California at the time.[2] His profession? Publicizing the Gold Rush in newspapers and running a store selling picks, shovels, and pans. The difference in investing vs. speculating.
While you might have thought we learned our lesson, the original 49ers aren’t the only speculators in gold. To a large extent, the gold bugs of today are just as starry-eyed as those of the past, betting on gold as an inflation hedge. However, history has shown that over long periods of time, gold has often failed to outpace inflation, even before considering fees. Just look at inflation (as measured by the CPI-U index) vs. gold (as measured by the gold spot price from Bloomberg) returns since 1980.[3][4]

Sources: Morningstar, as of September 2022. Inflation is represented by the Consumer Price Index for All Urban Consumer (CPI–U), not seasonally adjusted. The Gold Spot Price is based on USD returns from composite prices from Bloomberg. See Important Disclosure Information.[3][4]
Since 1980, gold has failed to live up to its luster as an antidote to inflation. The U.S. stock market (as measured by the S&P 500) on the other hand: up nearly 9,000% over that same period.[5] However, it is important to note that the S&P 500 has had periods of up to 17 years when it has underperformed CPI-U inflation on an annualized basis.[6] Nonetheless, while past performance is no guarantee of future results, this may be a lesson the next time you hear others panning the stock markets.
Important Disclosure Information & Sources:
[1] “California Gold Rush“. History.com Editors, 10-Aug-2022, history.com.
[2] “Samuel Brannan: Gold Rush Entrepreneur“. PBS, pbs.org.
[3] The Consumer Price Index for All Urban Consumers: All Items (CPI-U) is a price index of a basket of goods and services paid by urban consumers, including roughly 88 percent of the total population, accounting for wage earners, clerical workers, technical workers, self-employed, short-term workers, unemployed, retirees, and those not in the labor force. Returns data sourced from Morningstar.
[4] The gold spot price is measured by composite USD price returns as measured by Bloomberg. Returns data sourced from Morningstar.
[5] The S&P 500 Index is a free float-adjusted market-capitalization-weighted index of 500 of the largest publicly traded companies in the United States. Returns data sourced from Morningstar.
[6] “Are Stocks Riskier Than Bonds?“ Bobby Adusumilli, 07-May-2021, sjsinvest.com.
There is no guarantee investment strategies will be successful. Past performance is no guarantee of future results. Diversification neither assures a profit nor guarantees against a loss in a declining market.
Indices are not available for direct investment. Index performance does not reflect the expenses associated with management of an actual portfolio. Index performance is measured in US dollars. The index performance figures assume the reinvestment of all income, including dividends and capital gains.
Statements contained in this report that are not statements of historical fact are intended to be and are forward looking statements. All forward looking statements are inherently uncertain as they are based on various expectations and assumptions concerning future events and they are subject to numerous known and unknown risks and uncertainties which could cause actual events or results to differ materially from those projected.
Hyperlinks to third-party information are provided as a convenience.